What is Tail Spend Analysis? A Complete Guide
The Procurement Problem Nobody Wants to Talk About
Every procurement team in India knows their top vendors. The big contracts get negotiated properly, reviewed regularly, and tracked closely.
But scroll past those top 20 suppliers in your vendor list. What do you see?
Dozens sometimes hundreds of small vendors. Irregular purchases. No negotiated rates. No contracts. Nobody really managing it.
That’s tail spend. And for most Indian businesses, it’s silently eating into budgets every single month.

What is Tail Spend?
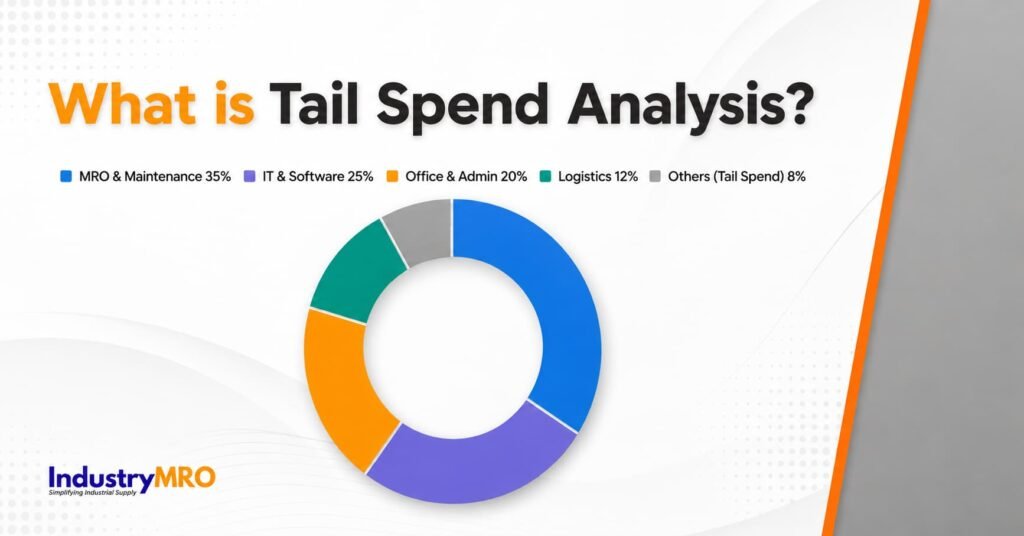
Tail spend refers to the large volume of low-value, fragmented purchases that fall outside an organisation’s formal procurement process. Each transaction looks small on its own — ₹3,000 for safety gloves here, ₹7,500 for fasteners there. But collectively, tail spend typically accounts for 10% to 30% of total procurement expenditure.
The concept is rooted in the Pareto Principle, or the 80/20 rule, which in procurement plays out like this:
- 20% of your suppliers handle roughly 80% of your total spend
- 80% of your suppliers handle the remaining 20% of spend and that 20% is your tail spend
Procurement teams naturally focus time and effort on the strategic 20%. The long tail that 80% of suppliers largely goes unmanaged. That’s where the waste lives.
What is Tail Spend Analysis?
Tail spend analysis is the process of identifying, categorising, and examining those low-value, high-volume purchases to find inefficiencies, savings opportunities, and compliance gaps hiding in your procurement data.
It answers questions your finance and procurement teams probably can’t answer right now:
- Which categories have too many active vendors?
- Are employees buying off-contract without approval?
- Where is the same item being purchased from five different suppliers?
- Which vendors can be consolidated to unlock better pricing?
- How much of our indirect spend is completely untracked?
Tail spend analysis is also commonly referred to as tail end spend analysis or long tail spend analysis all the same thing, just different names used across the industry.
Common Examples of Tail Spend in Indian Businesses
Tail spend shows up differently depending on the industry. In Indian manufacturing, industrial, and infrastructure businesses, the most common tail spend categories include:
MRO Supplies (Maintenance, Repair & Operations)
Bearings, lubricants, fasteners, cutting tools, filters — bought frequently, in small quantities, from whoever’s available. Classic tail spend.
Safety Equipment and PPE
Helmets, gloves, safety shoes, harnesses — often purchased reactively when stock runs out, from random local vendors without price agreements.
Office and Facility Consumables
Stationery, cleaning products, printer cartridges — low priority, decentralised, and almost never through a proper purchase order.
Electrical and Maintenance Consumables
Wires, switches, bulbs, tapes the kind of items that get expensed informally or bought on petty cash.
One-Off Professional Services
Plumbers, electricians, minor contractors are hired without formal vendor onboarding or rate cards.
None of these feel urgent to manage. That’s exactly why tail spend analysis is so valuable — it surfaces what’s being ignored.
Why Tail Spend Management Matters: 5 Real Reasons
1. Direct Cost Savings
Organisations that bring tail spend under management typically unlock 5% to 20% savings on that spend. For a business with ₹4 crore in annual indirect procurement, that’s ₹20 lakh to ₹80 lakh sitting untouched.
2. Supplier Consolidation Reduces Complexity
Managing 300 tail spend vendors means 300 relationships, 300 invoice processes, and 300 payment cycles. Reducing that to 50 preferred vendors cuts administrative costs significantly — often more than the price savings themselves.
3. Compliance and Maverick Spend Control
Maverick spending — purchases made outside approved procurement channels — is almost entirely a tail spend problem. Tail spend analysis reveals where it’s happening and how much it’s costing.
4. Full Spend Visibility
Finance teams trying to forecast indirect costs without tail spend data are working blind. Tail spend analysis fills that gap, giving organisations complete procurement visibility.
5. Better Resource Allocation
Once tail spend is managed through preferred vendors and automated workflows, procurement teams stop wasting time processing hundreds of small transactions — and start focusing on strategic sourcing that moves the needle.
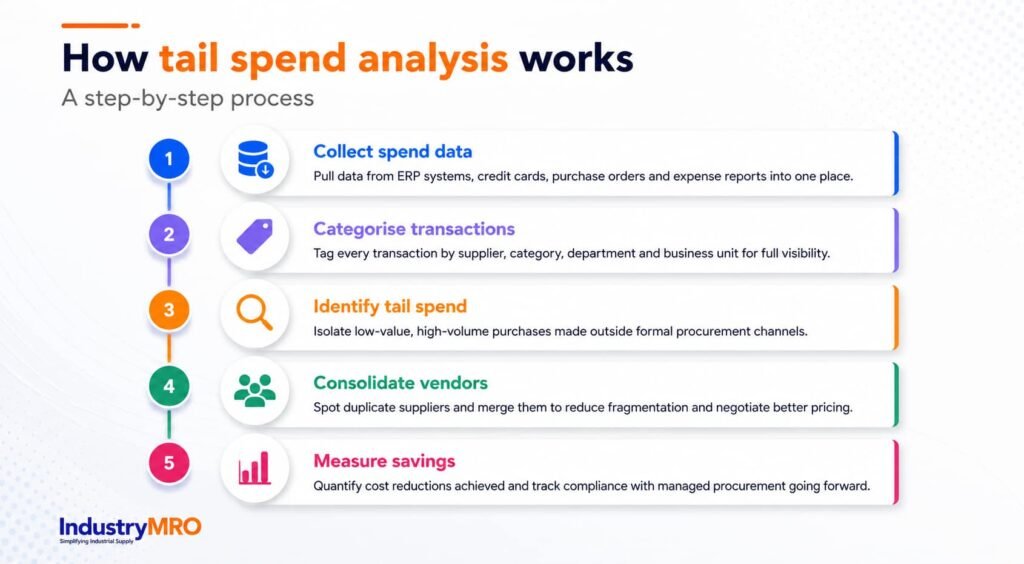
How to Perform Tail Spend Analysis: Step-by-Step
Step 1: Gather All Procurement Data
Pull data from every source — your ERP, purchase orders, vendor invoices, credit card statements, expense reports, even informal purchase records. The goal is zero blind spots. If a purchase happened, it should be in your dataset.
Step 2: Clean and Normalise the Data
This step is unglamorous but essential. The same vendor might appear as “Verma Traders,” “Verma Trading Co.,” and “V. Traders” across different records. Duplicate entries, inconsistent categories, and missing invoice details need to be fixed before any meaningful analysis is possible.
Step 3: Categorise Your Spend
Group all purchases into clear procurement categories — MRO, IT equipment, safety, office supplies, facility services, professional services. This categorisation is what allows you to spot patterns and concentration of tail spend.
Step 4: Define Your Tail Spend Threshold
Every organisation draws the line differently. Some define tail spend as any purchase under ₹50,000. Others use transaction frequency or supplier count as the defining factor. Set a threshold that fits your business size and procurement maturity.
Step 5: Identify Consolidation Opportunities
This is where tail spend analysis pays off. Look for:
- Multiple vendors supplying identical or similar items
- Categories with no preferred vendor or contract in place
- High-frequency purchases with no negotiated pricing
- Departments regularly buying the same items from different suppliers
Step 6: Build a Strategy and Monitor
Set up preferred vendor lists for your highest-volume tail spend categories. Create simple, employee-friendly buying workflows. Enforce procurement policies. Then track it — tail spend analysis isn’t a one-time exercise. It needs to be revisited quarterly or at minimum twice a year.
Tail Spend Analysis and MRO Procurement in India
For manufacturers, plant operators, and industrial businesses across India, MRO procurement is the single biggest source of tail spend and the most overlooked.
Maintenance, repair, and operations items are bought constantly, across multiple departments, by multiple people. A plant manager in Pune ordering bearings from one vendor. The maintenance team in Hyderabad buying the same bearings from a completely different local supplier. No consolidation. No price visibility. No spend data.
This fragmented MRO buying is exactly the kind of indirect tail spend that tail spend analysis is designed to fix.
At IndustryMRO, we supply a comprehensive range of MRO and industrial products across India — helping businesses consolidate their MRO vendor base, negotiate better pricing, and gain the kind of spend visibility that makes tail spend management actually work.
Key Challenges in Tail Spend Management
Even after doing the analysis, managing tail spend comes with real obstacles:
Poor data quality. Inconsistent records make accurate analysis difficult without significant upfront effort.
Decentralised buying behaviour— When 50 people across 5 departments are all placing small orders independently, centralising that behaviour takes time and cultural change.
Low perceived ROI — ₹5,000 purchases feel too small to manage strategically, even when they add up to crores annually.
Supplier resistance — Existing local vendors who’ve supplied a business for years won’t appreciate being displaced by a preferred vendor consolidation strategy.
Resource constraints — Most procurement teams are already stretched. Tail spend management needs to be light-touch and largely automated to be sustainable.
Tail Spend Management Best Practices
- Start with two or three categories — don’t try to fix everything at once. Pick MRO or safety equipment first, nail that, then expand.
- Make compliant buying easier than non-compliant buying — if the approved process is faster and simpler, employees will follow it
- Create preferred vendor agreements before shutting out existing suppliers — give people a better option, not just a restriction
- Use spend data in vendor negotiations — even showing a vendor your total annual spend across categories can unlock better pricing
- Automate repeat purchases — anything bought regularly at fixed specs should go through an automated PO workflow, not a manual process every time
- Review quarterly — tail spend creeps back the moment you stop watching
Frequently Asked Questions About Tail Spend Analysis
What is the difference between tail spend and maverick spend?
Tail spend is any low-value, fragmented purchase — it can be compliant or non-compliant. Maverick spend is specifically purchasing that happens outside approved channels or contracted suppliers. Maverick spend is often hidden within tail spend.
What percentage of procurement spend is tail spend?
Industry estimates typically put tail spend at 10–30% of total procurement spend, representing 80% of transactions and 80% of active suppliers.
Is tail spend the same as indirect spend?
Not exactly. Most tail spend is indirect, but direct tail spend exists too — low-value spot buys, emergency component purchases, or out-of-contract raw material transactions also qualify.
How do I reduce tail spend?
Through supplier consolidation, preferred vendor programs, guided buying tools, procurement policy enforcement, and regular spend analysis. The goal isn’t to eliminate tail spend — it’s to bring it under management.
Final Thoughts
Tail spend analysis won’t make headlines inside your organisation. There are no big contract wins or dramatic cost reduction announcements.
But the numbers are real. Businesses that manage tail spend effectively save 5% to 20% on indirect procurement. They cut supplier complexity. They improve compliance. And they give their procurement teams back time to focus on work that actually moves the business forward.
If your business has never run a proper tail spend analysis — start this week. Pull three months of indirect procurement data. Count your active vendors. See how many of them are supplying the same categories with no contract and no negotiated rate.
The picture won’t be comfortable. But it’ll tell you exactly where the opportunity is.
IndustryMRO supplies a wide range of MRO and industrial products across India — helping procurement teams consolidate vendors, control indirect spend, and build a more efficient supply chain.